

How many people are in the gig economy?
We’re very interested in this question at Nation1099, and, as it happens, it isn’t an easy question to find answers to, especially since the gig economy is growing and changing very fast and people mean many different things by the term.
Employment in general is undergoing dramatic changes, often summarized as “the future of work” or Workforce 2.0. Anyone following workforce trends will have seen eye-popping numbers about the gig economy along the lines of “one third of all workers are freelancers” or “half of us will be in the gig economy by 2020.”

But these statistics, which we will review in detail below, use broad definitions of the gig economy. They often lump together strategy consultants, freelance designers, musicians, drivers for ride-sharing apps, day laborers and people who work for temp agencies.
The Career Freelancer Status Report: Results From The Nation1099 Survey, 2018
And the headlines about these studies on the gig economy usually conflate full-time freelancers, part-timers and people who had only one gig in the last year.
All of these are part of the picture, of course. But if you’re trying to understand how many people work in the gig economy instead of in a traditional job, you need to rule out people who freelance as a side hustle or who are only dipping their toes in.
A short history lesson: Why is it so difficult to get gig economy statistics?
The Bureau of Labor Statistics Contingent Worker Supplement
Other government data on the gig economy
How many people work in the gig economy? The three best data sources
1. The UpWork/Freelancers Union survey of freelancers
2. The McKinsey Global Institute survey of independent workers
3. The MBO Partners “State of Independence” survey
Other ways of estimating the size of the gig economy
1. Read between the lines of tangential studies
2. Ask companies how many freelancers they employ
3. Look where the job growth is
4. Examine the make up of one industry
5. Examine economic activity of freelance work
7. Count all the “nonemployer firms”
Is the gig economy just for millennials? Other interesting and comprehensive studies of the freelance workforce
T. Rowe Price, Financial Attitudes & Behaviors Toward the Gig Economy Survey
The NPR/Marist “Nature of Work” Poll
The Marketplace-Edison Research Economic Anxiety Index
How many freelancers are there globally?
What it’s like being a freelancer
Three trends that show how the freelance workforce is changing
Trend 1: Freelancing no longer means “between jobs.”
Trend 2: Freelance doesn’t necessarily mean outsider
At Nation1099, our focus is on the knowledge work part of the gig economy — people selling professional or creative skills on a freelance basis.
And, as we want to help professionals get better at managing and growing their freelance businesses, we’re interested to understand how many people are full-time in the gig economy.
So, in this ultimate guide to gig economy data, I’m going to round up and summarize all the reports, surveys and studies we can find.
But I also have a secondary purpose of trying to answer the questions that interest us most: How many people are actually “making it” as freelancers? How many are freelance instead of in a traditional full-time job?
Another reason it’s difficult to answer how many people are in the gig economy is that some key stakeholders aren’t actually counting us. For interesting historical reasons that we’ll get into below, there is little government data about people who make their living freelancing.
But however imperfect the data sources that do currently exist, there is still no doubt that the gig economy is the future. Consulting firm Accenture makes the case forcefully in Technology Vision 2017 report. They predict that legacy models of employment will be “dissolved and replaced with talent marketplaces” driven by the “surge of on-demand labor platforms and online work management solutions.”
We plan to update this list of gig economy data sources regularly, so please do let us know about any we missed or if your organization publishes good data in the meantime.
For now, here’s our conclusion: Based on this synthesis of all the high-quality studies we can find, we estimate that approximately 11 percent of the working adult population in the U.S. are working primarily as full-time independent contractors in the gig economy.
That’s considerably lower than the numbers about the gig economy that you see in the headlines. But it’s also a more meaningful figure that shows how much the future of work is defined by professional freelancing.
Read on below to see how I get to that estimate. Alright, let’s dive in . . .
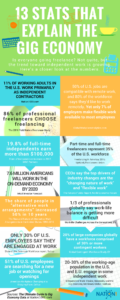
Statistics that explain the gig economy
- 86 percent of professional freelancers choose freelancing. – The 2016 Field Nation Freelancer Study
- 35 percent of the U.S. workforce — 55 million people — freelanced in 2016. – Freelancing In America, 2016, UpWork/Freelancers Union
- Update: 36 percent/57.3 million according to the 2017 survey
- 15.8 percent of workers are engaged in alternative work arrangements — defined as temp agency workers, on-call workers, contract workers, independent contractors or freelancers. – The Rise and Nature of Alternative Work Arrangements in the United States, 1995-2015 by Lawrence Katz and Alan Krueger
- 19.8 percent of full-time independents earn more than $100,000. – MBO Partners State of Independence In America 2017
- Update: 20.9 percent according the the 2018 survey.
- By 2027, more than half of American workers — 58 percent — will have had some experience as independent contractors. – MBO Partners Looking Forward: What Will the Independent Workforce Look Like In 2027?
- Not only are executives looking to hire experienced contractors. 63 percent of full-time executives would switch to become a contractor, given the opportunity. – The White-Collar Gig Economy: Four On-Demand Workforce Trends According to Today’s Business Leaders, Mavenlink
- 20 percent of organizations globally with more than 1,000 employees have a workforce that is made up of 30 percent or more contingent workers. – Global Contingent Workforce Study, EY
- 7.6 million Americans will be working in the on-demand economy regularly by 2020. – Intuit Investor Forecast
- 26 percent of U.S. employees say they are somewhat likely or likely to become a freelancer or independent contractor. – Happy in the Home Office, Freelancers Embrace the Gig Economy, ReportLinker
- Only 30 percent of U.S. employees describe themselves as engaged at work. – State of the American Workforce Report, Gallup
- One-third of professionals globally say that work-life balance is becoming more difficult. Excessive overtime and a lack of flexibility are among the top reasons people leave jobs. 24 percent say they would take a 10 percent pay cut to be able to telecommute. – Work-life Challenges Across the Generations, EY
- 81 percent of working parents say work-life balance is more important than pay when looking for a new job. 70 percent have thought about leaving a job because it doesn’t offer flexibility. – Working Parents in 2017: What They Want at Work, Flexjobs
- 51 percent of U.S. workers are searching for a new job or watching for openings. – American Workplace Changing at a Dizzying Pace, Gallup
- 32 percent of workers have changed jobs in the last two years. – NPR/Marist “Picture of Work” poll
- 50 percent of U.S. jobs are compatible with remote work arrangements, and 80 percent of the workforce says they would like to work remotely at least part time. Yet only 7 percent of employers make flexible work available to most employees. – GlobalWorkplaceAnalytics.com
- 74 percent of North American office workers say they would quit their jobs for another that allows them to work remotely more often. – Collaboration Unleashed, Softchoice
- 94 percent of workers are open to non-traditional forms of work. – Gig Responsibly: The Rise of NextGen Work, Manpower Group
- Among millennials, 69 percent wish they had chosen a job with better work/life balance, and 44 percent wish they had chosen a job they enjoyed more. – 2018 Better Money Habits Millennial Report, Bank of America
- 44 percent of business leaders say the top socio-economic driver of changes in industry is the “changing nature of work, flexible work.” – The Future of Jobs Report, World Economic Forum
- 20 to 30 percent of the working-age population in the United States and the European Union engage in independent work. – Independent work: Choice, Necessity, and the Gig Economy, McKinsey Global Institute, 2016
- The average freelancer reaches their financial goal in 23 months. – State of the Freelance Nation 2018 Survey, WiseBrand
- 61 percent of Gen Z professionals in APAC countries agree that job seekers are seeking flexible and contract-based roles. – 2018 APAC Workforce Insights – Gig Economy: How Free Agents Are Redefining Work, PERSOLKELLY
- There is a 12 percentage point gap between men and women in traditional full-time jobs but a five-point difference between men and women working in the gig economy. – 2018 Financial Attitudes & Behaviors Toward the Gig Economy, T. Rowe Price
A short history lesson: Why is it so difficult to get gig economy statistics?
In 2001, before smartphones, cloud computing and videoconferencing, Daniel Pink published Free Agent Nation: The Future of Working for Yourself in which he effectively predicts the workforce changes we’re seeing now.
One interesting thing about Pink’s reporting is how much it had to rely on anecdotes rather than conclusive data. As Pink explained himself, the U.S. government didn’t really do a headcount of free agents. The U.S. Bureau of Labor Statistics (BLS) understandably wants to show long-term trends, so they don’t add survey questions lightly, and they don’t revise categories based on what’s trendy.
As a result, for generations the BLS really just counted three broad categories: farm employment, non-farm employment and employer. There weren’t many gradations for job categories in their data beyond that, except by industry.
Source: U.S. data from Independent work: Choice, Necessity and the Gig Economy, McKinsey Global Institute, 2016
You can see the limitations of that pretty quickly. For example, full-time consultants are presumably self-employed, but from the BLS’ perspective that puts them in the same bucket as the owners of cafes, food trucks, auto garages and other small businesses — or factory owners, for that matter.
“Self-employed” in that case doesn’t really tell you much about the size of the gig economy.
The BLS Contingent Worker Supplement
It’s amazing the extent to which this issue that Pink ran into in 2001 is still relevant 16 years later.
In fact, a recent article by BLS economists notes that the last helpful survey on “contingent workers” was from 2005 and found that they accounted for 2 to 4 percent of all workers.
In that case, the BLS was probably counting temps and day laborers rather than freelance professionals anyway.
[Update June 11, 2018] In June 2018, the BLS released a long-awaited update to their last report from 2005, using a survey on contingent and alternative work arrangements conducted in 2017. The Contingent Worker Supplement (CWS) provided more new questions than answers.
For one thing, it only counts people who earn their primary income this way rather than moonlighters. That’s a good thing for my purposes since I’m trying to identify full-time career freelancers.
And the number they arrive at — 6.9 percent “independent contractors” plus 3.8 percent “contingent workers” — adds up to something in the ballpark of our 11 percent estimate. The difference between that and the 36-50 percent figures in other studies is explained by the difference between exclusively 1099 and the larger group of occasionally 1099 while primarily W-2.

On the other hand, the BLS is saying these number are actually lower than in 2005, which doesn’t align with any other study.
Others have already sorted through that disconnect (and the weaknesses in this survey), so I’ll refer you to the analysis of Sama School and Steve King, whose firm Emergent Research has been involved in several of the studies below.
For example as he notes that the survey excludes people who are self employed and don’t have services businesses.
I still have two other questions that aren’t addressed in those analyses. Somebody who is more expert in this please chime in below in the comments.
- This survey was a supplement asked by the BLS in their regularly monthly survey of “all employed persons.” But I wonder if 1099s recognize themselves in the design of surveys of employed persons and so flush themselves out of the survey long before these supplemental questions. Below I discuss a number of other survey questions about the workforce that are essentially unanswerable by career freelancers, and I wonder if that is a factor here.
- The intro to the BLS survey indicates this was “designed to identify individuals who found short tasks or jobs through a mobile app or website and were paid through the same app or website.” That’s basically a description of something that didn’t exist in 2005. How can you the survey find fewer people now than in 2005 in that case? Also, does designing to find Uber drivers impact the likelihood of finding freelancers and consultants?
Other government data on the gig economy
Other government offices have data on the freelance workforce with similar limitations. In 2014, the U.S. Government Accountability Office (GAO) attempted to get some perspective on the size and characteristics of the gig economy. Their 96-page report looks at statistics from the BLS, the Census Bureau, the Internal Revenue Service and elsewhere.
Depending on how those agencies define a contingent worker, they arrive at figures ranging from 5 percent to 40 percent of the workforce. Which is just another way of saying we don’t really have a common working definition of what a gig economy worker is.
From my perspective, the GAO isn’t on track to get a clear picture of the the gig economy, because they are looking at it the wrong way. The question they are asking presupposes a “deficit” perspective about the freelance economy:
“No clear consensus exists among labor experts as to whether contingent workers should include independent contractors, self-employed workers and standard part-time workers, since many of these workers may have long-term employment stability. There is more agreement that workers who lack job security and those with work schedules that are variable, unpredictable or both—such as agency temps, direct-hire temps, on-call workers and day laborers—should be included.”
In other words, the GAO is really trying to measure job insecurity. But in the emerging gig economy, what one worker calls job insecurity another may say is the whole point of going freelance.
As we’ll see below, more and more people choose freelancing so that they command their own fate or because they value the flexibility.
The Federal Reserve Board conducts a regular Survey of Household Economics and Decision Making that has some relevant questions embedded in it. They found in the May 2018 report that 30 percent of adult U.S. workers worked in the gig economy “in the last month.” Note that the higher numbers in some surveys below ask about income “in the last year.”
They defined gig work specifically as “occasional work activities or side jobs,” so I’m not sure where full-time freelancers identify themselves in the survey.
Official numbers are similarly difficult to find in the U.K. The Office for National Statistics, which is responsible for collecting employment data in that country, is also at the stage of publishing reports on the feasibility of measuring the sharing economy. (Short version: it’s not easy.)
The relevant U.K. government agencies are still in the process of developing and adding questions to the surveys they give to workers, employers and tax filers.
How many people work in the gig economy? The three top data sources
While government data on the gig economy isn’t easy to find, trade associations and think tanks are stepping into the breach for now, along with companies selling services in this area. Most of the data you may have seen cited before is coming from these sources.
First, let’s look at three major surveys that attempt to tally up all the freelancers.
1. The UpWork/Freelancers Union survey of freelancers
One of the most comprehensive is a 2016 study commissioned by Upwork and Freelancers Union, which has a +/- 1.27 percent margin of error at 95 percent level of confidence.
But this study has one of the complications introduced above: it counts anyone who has engaged in supplemental, temporary, project-based or contract-based work at all within the last 12 months.
Many of the headlines about this study, therefore, look only at the total figures and lump everyone together.
By that count, 35 percent of the U.S. workforce — 55 million people — are freelancing. Deeper behind the headline number, though, the Upwork and Freelancers Union study has data closer to what we’re looking for by breaking out that 55 million people into more meaningful segments.
A 60 percent share of the original 35 percent is made up of people who are primarily in traditional employment — what the authors call diversified workers (28 percent/15.2 million), moonlighters (25 percent/13.5million) and temporary workers (7 percent/3.6 million).
The rest, a subset of approximately 42 percent of the 35 percent, are independent contractors (35 percent/19.1 million) or freelance business owners (7 percent/3.6 million).
Each of those groups is an interesting early predictor of the future of work, but if the question is how many people have gone full-time freelance to replace a traditional job, the Upwork/Freelancers Union study shows that the number is closer to 14.7 percent.
2. The McKinsey Global Institute survey of independent workers
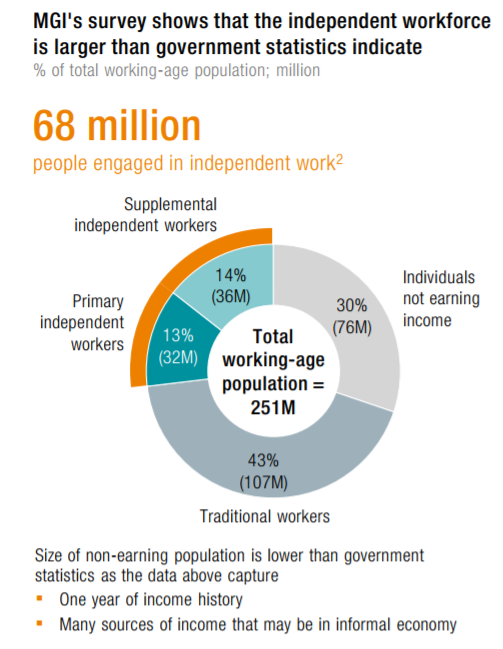
Next, let’s look at Independent Work: Choice, Necessity and the Gig Economy from McKinsey Global Institute, which conducted a survey in the U.S. and Europe and found that 20 to 30 percent of the working-age population is engaged in independent work.
That’s up to 162 million individuals. The McKinsey Global Institute study groups contingent workers into four categories:
- Free agents — These freelancers actively choose gig economy work as their career or professional framework. Free agents are 30 percent of independent workers in the U.S. and Europe, numbering around 49 million.
- Casual earners — These are professionals who also choose to freelance to augment their primary income. These part-time freelancers number around 64 million, representing 40 percent of the contingent worker population in Europe and the U.S.
- Reluctants — These are like full-time free agents, but not by choice. Reluctants were either laid off or are hindered in some way from getting traditional employment. They derive their primary income from the gig economy. They number around 23 million, accounting for 14 percent.
- Financially strapped — These are similar to casual earners but more out of necessity than choice. They freelance because they need to augment their primary income. Financially strapped freelancers could be as many as 26 million and account for 16 percent of the contingent workforce in the US and Europe.
So, a subset of about 43 percent of the original 20-30 percent make their living primarily from independent work. For the rest, it’s a side hustle.
That implies that around 8.6 percent to 12.9 percent of working adults in the U.S. and Europe are full-time freelancers, either by choice or reluctantly.
The more enthusiastic share of that group accounts for 6-9 percent.
3. The MBO Partners “State of Independence” survey
MBO Partners conducts an annual survey of the independent workforce in the U.S. that paints a similar picture. They find in the 2017 survey that 40.9 million adults are self employed, representing $1.2 trillion in revenue or 6 percent of the GDP.
Update from the 2018 report: 41.8 million adult Americans work independently.
The MBO survey projects 3.6 percent annual growth in this workforce and that during the next five years half the adult U.S. population will have worked independently, but that includes in the mix people who freelance only part-time or occasionally.
Update from the 2018 report: 52 percent of the private workforce will have spent time as independent workers at some point.
If you are trying to understand the long-term trends in the independent workforce, this annual report is the best source of data, and you’ll see more particular insights drawn from their annual survey sprinkled throughout this article.
Other ways of estimating the size of the gig economy
So, relying on my unscientific reading of the above surveys, and focusing on my interest in knowing especially how many people full-time freelance rather than in traditional jobs, we’re looking at a range of 8-14 percent. And that’s how I arrive at the estimate I gave in the intro:
Approximately 11 percent of the working adult population in the U.S. are primarily working as full-time independent contractors in the gig economy.
While we’re waiting for more surveys that ask this specific question, let’s see if we can find other ways to estimate how big the freelance workforce is:
1. Read between the lines of tangential studies
I found a write up about one other survey that asks the question that interests us. But I’m not able to see the report itself or much about detail about how the survey was conducted. ReportLinker asked 1008 online respondents in “the general U.S. population” which professional situation best describes them. They found that:
- 8 percent are full-time freelance.
- 15 percent are part-time freelance.
- 77 percent are full-time employees.
2. Ask companies how many freelancers they employ
Another way of gauging the size of the gig economy is to look at what companies say about where their workforce comes from.
In its 2016 Global Contingent Workforce Study, professional services firm EY (f.k.a. Ernst & Young) asked companies around the globe how much of their workforce was contingent. The average was 17 percent.
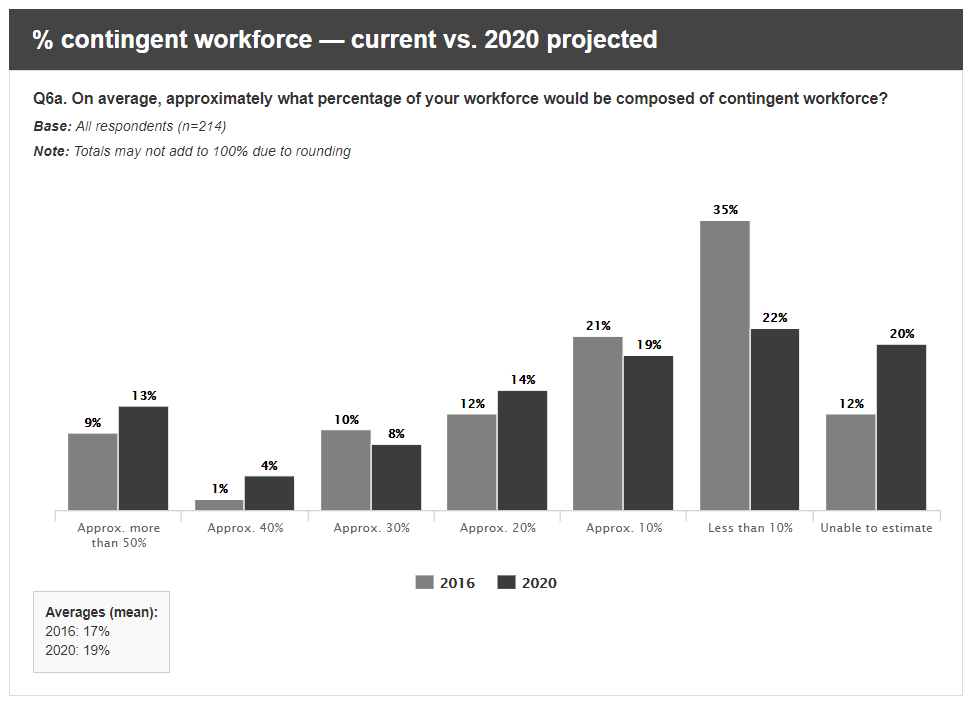
Source: Global Contingent Workforce Study, EY
Other figures of note from the EY survey on the gig economy:
- Twenty percent of the world’s organizations have a workforce comprised of at least 30 percent contingent workers.
- Half of the organizations have had a significant increase in the use of gig economy workers in the last five years.
- By 2020, 25 percent of businesses will have a contingent workforce comprising at least 30 percent of its talent resources, with one in five workers across the globe is actively engaged in gig or freelance work.
EY surveyed companies with more than 1,000 employees, so their data leaves out startups and small employers where the percentages might be different. (My hunch is that startups, being new companies, are more likely to use flexible talent sources and that established small companies might have less flexibility.)
The EY survey also leaves out employers who are not companies at all. Much of the demand side of the gig economy is from individuals, essentially in a peer-to-peer model. Freelance marketplaces like Upwork let individuals hire freelancers for gig work.
And many freelancers run their businesses by hiring subcontractors.
3. Look where the job growth is
Another way of estimating the size of the gig economy is to look at where the job growth is. A study by Harvard’s Lawrence F. Katz and Princeton’s Alan B. Krueger found that “all of the net employment growth in the U.S. economy from 2005 to 2015 appears to have occurred in alternative work arrangements.”
The authors found that total U.S, employment grew by 9.1 million jobs between February 2005 and November 2015. They trace that primarily to alternative arrangements such as freelance contracts.
4. Examine the make up of one industry
A fourth alternative approach to understanding how many people are in the gig economy is to look at just one profession and see the different ways that people work in it.
Stack Overflow’s comprehensive annual survey of software developers does this, asking about tools, education level, company size, working conditions and many other factors for this group of professionals.
And deep in the survey is a question about employment status.
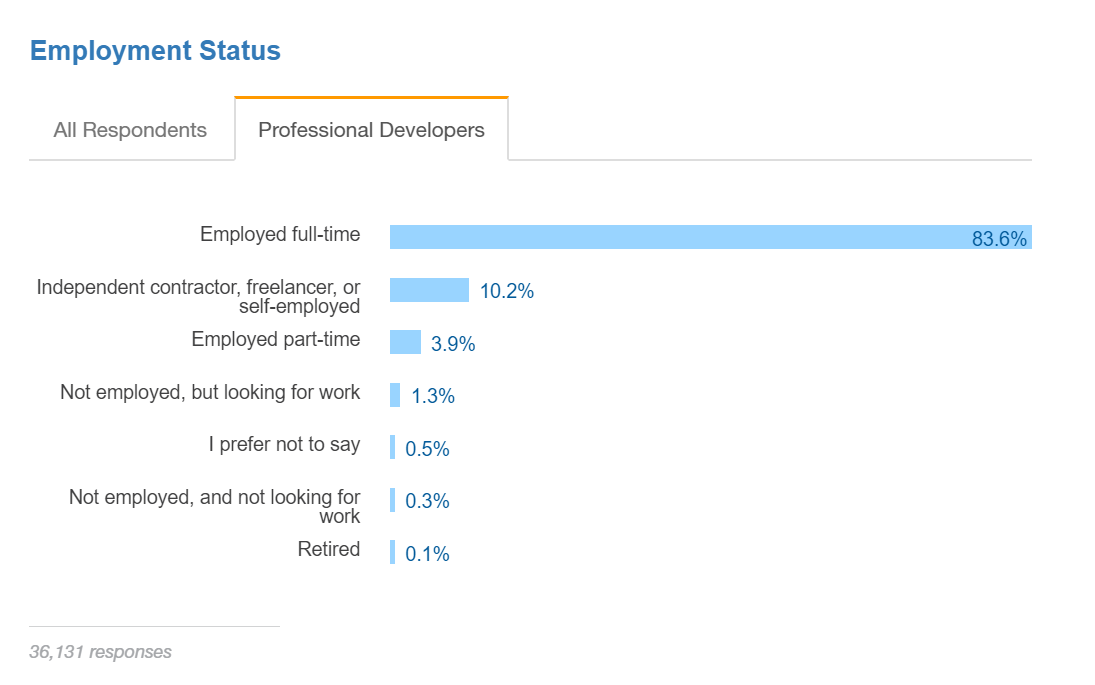
Source: Stack Overflow, Developer Survey Results, 2017
Ten percent of the developers in the survey identify as independent, freelance or self-employed. That doesn’t include part-time and side hustle work.
There’s no way of knowing what a similar survey of writers, photographers, designers or marketing experts would show. But if you hypothesize that developers represent a “typical” group of professional or creative workers, then the Stack Overflow survey suggests that an estimated 10 percent of the workforce works primarily in the gig economy.
5. Examine economic activity of freelance work
We could look for statistics on what freelancers contribute to economic activity.
Again, there isn’t much data on that, and it’s not possible to extrapolate from it how man freelancers are involved in generating that activity. The best longitudinal data on this point is from the MBO report discussed above, which in 2017 shows that freelancers generated $1.2 trillion for the U.S. economy, which is 6 percent of GDP.
Among full-time freelancers, 17 percent “export” their services to clients abroad, and that increased 13 percent from the prior year’s survey.
Update from MBO’s 2018 report: “Independent workers generated roughly $1.3 trillion of revenue for the U.S. economy, equal to about 6.7 percent of U.S. GDP.” 19 percent of full-time freelancers are exporters of services.
The 2017 edition of the Freelance Union/Upwork survey says freelancers contributed $1.4 trillion of economic activity and that it jumped 30 percent from the prior year.
6. Count all the 1099 forms
Eli Duordo and Christopher Koopman, research fellows at the Mercatus Center of George Mason University, produced an analysis in 2015 trying to document the “increase in nontraditional employment.” They simply tallied all the W-2 forms and 1099-MISC forms that the IRS had collected from workers since 1994.
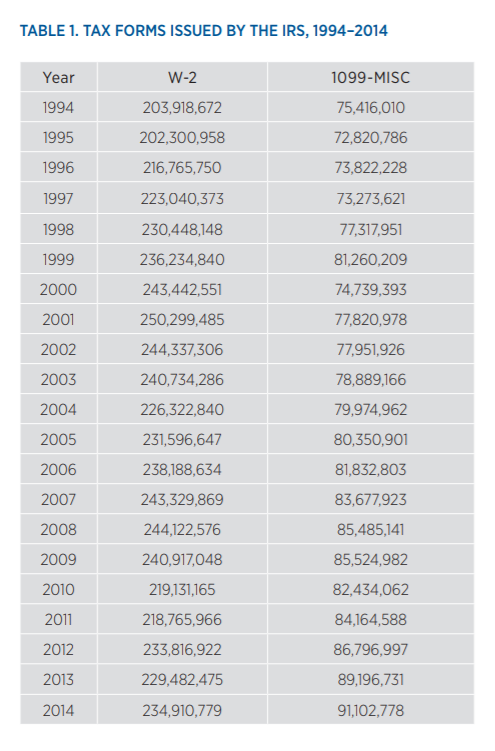
“Evaluating the Growth ofthe 1099 Workforce”, Mercatus Center, George Mason University
That shows around a 22 percent increase in the number of 1099 forms since 2000 and a decline of 3.5 percent in the number of W-2 forms.
The authors observe that the divergence begins well before the rise of sharing economy and gig work platforms, suggesting that Uber and AirBnB don’t explain the trend toward more freelance work.
Still, this isn’t a perfect accounting either. For example, they are using the 1099-MISC form as a proxy for freelancing, but the MISC reports freelance income between $600 and $20,000. That’s going to leave out four significant groups that I can think of:
- People with small individual gigs of less than $600. (Probably a third of my own subcontractors last year were below that line and didn’t get a 1099 from me.)
- Consultants with contracts larger than $20,000 and so requiring IRS form 1099-K (aka “supertemps“).
- Freelancers who are very active on platforms like Upwork and earn more than $20,000 within a single reporting platform from multiple projects. (About half of the users of these platforms say one site is their primary source of income, according to a survey on Tipalti.)
- Freelancers whose clients don’t know they are supposed to create 1099s and so no form is ever created. (We’ve all had those clients. Our own reported income is always greater than the sum of the 1099s we receive.)
7. Count all the “nonemployer firms”
[Updated April 5, 2018] The Brookings Institute published research in 2016 — and has been maintaining data — on an interesting approach to estimating the size of the gig economy workforce. They are looking primarily at the “rides and rooms” portion of the gig economy, as Brookings fellows Ian Hathaway and Mark Muro put it in their original piece.
That’s less relevant to the question that interests us here of creative and professional services, but the analysis is still interesting. Essentially, “nonemployer firms” in the U.S. Census data is any “firm” that makes more than $1,000/year and that has no employees.
That makes an Uber driver a nonemployer firm, and presumably every freelance creative or independent consultant is also.
The authors combined the Census data with tax return data from the IRS and employment data from Moody’s to show some interesting trend lines. For example, between 1997 and 2014, the number of these businesses increased from 15 million to 24 million.
Payroll employment in that period increased from 129 million to 145 million. In other words, the gig economy is, while a small share of the workforce, is growing faster than the overall workforce, which is the same conclusion of several other studies.
Muro and Senior Research Analyst Robert Maxim updated this analysis recently with figures from 2015. It continues to show that employment growth has been growing faster in the freelance sector: 2.6 percent annually vs. 0.8 percent annually for payroll employment. 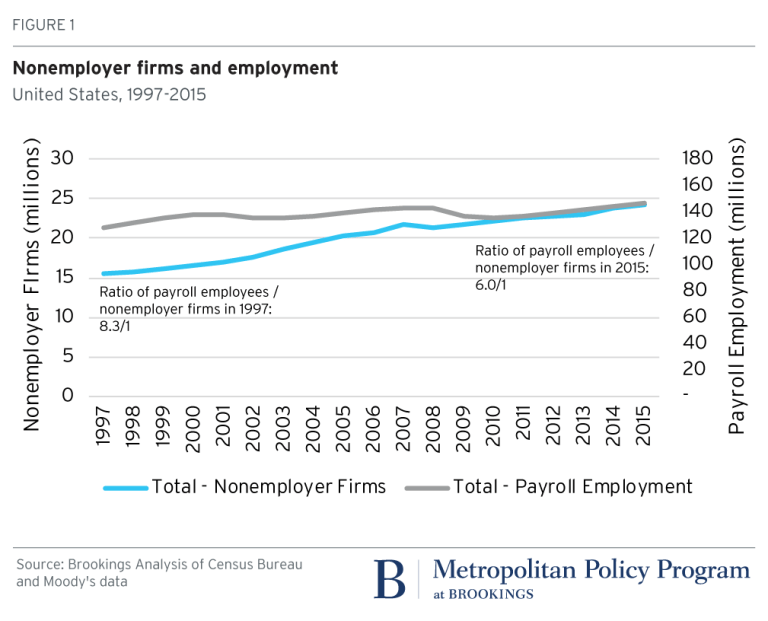 The original research looked at what happens in a given industry as gig economy platforms grow. Check out what happens to the data as Uber and Lyft and similar apps expand.
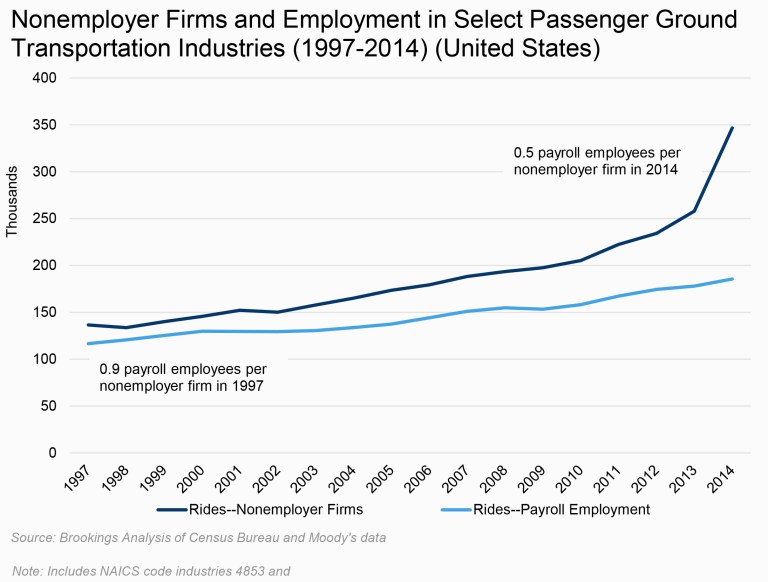
Now we just need the same approach to the data looking at the professional and creative services. Stay tuned.
Is the gig economy just for millennials?
In a later article, I’ll look at what these studies can tell us about the demographics and other characteristics of gig economy workers. When it comes to age, the data is inconsistent. For example, the NPR/Marist poll discussed at length below says that the contract workforce skews younger and male. 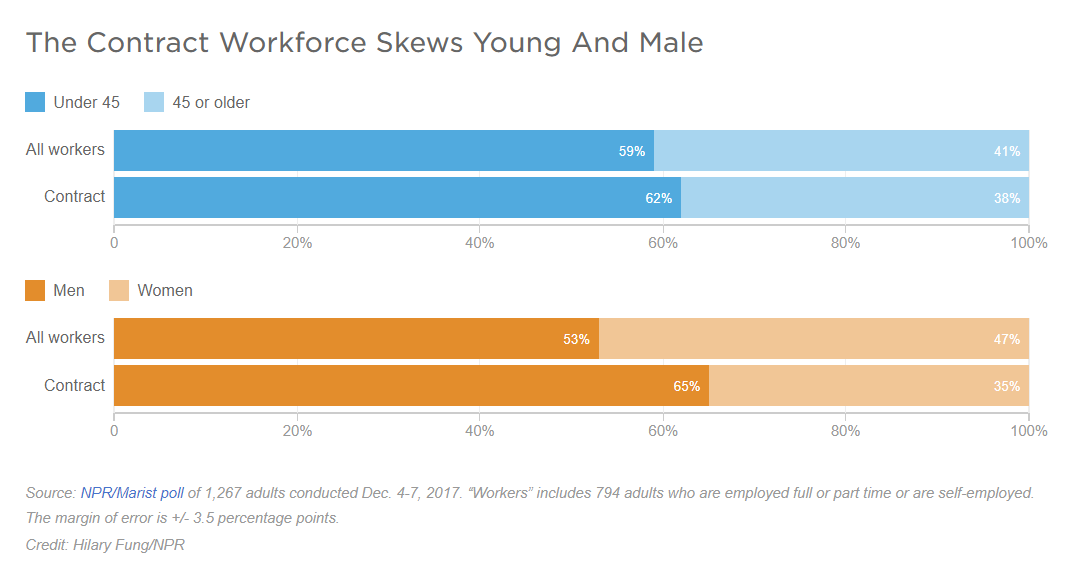 MBO Partners draws on their long-running annual survey to predict that “Gen Z will be the most independent generation of workers yet.” And the MBO Parners surveys show that attitudes associated with independent work are more common in millennials
“. . . In some areas—especially those having to do with the emotional and psychological payoff of work—they skew from the norm. For example, 51 percent of millennials with traditional jobs say more flexibility is an advantage of becoming an independent worker/starting your own business, compared with 42 percent of Gen X and 40 percent of baby boomers. Some 44 percent of millennials with traditional jobs say pursuing a passion or interest is an advantage of working independently, while only 32 percent of Gen X and baby boomers say it is a factor.”
Update: The 2018 report from MBO Partners finds that millennials are now the plurality of independent workers at 37 percent, while boomers and older make up 35 percent and Gen X make up 28 percent.
But it definitely would be overly simplistic to think the growth in freelancing is youth movement.
For example, a survey of U.S. executives by software company Mavenlink on the “The White-Collar Gig Economy” finds that professionals who are fit for senior roles are driving the growth of freelancing:
- 47 percent are looking to hire contractors to fill management and senior executive roles, including in the C-suite.
- The two qualities leaders value most in potential contractors are specialized degrees (35 percent) and a decade or more of experience (29 percent).
According to Hubstaff’s first annual Freelancing Trends survey of members on its platform, the average respondent has been freelancing for around six years.
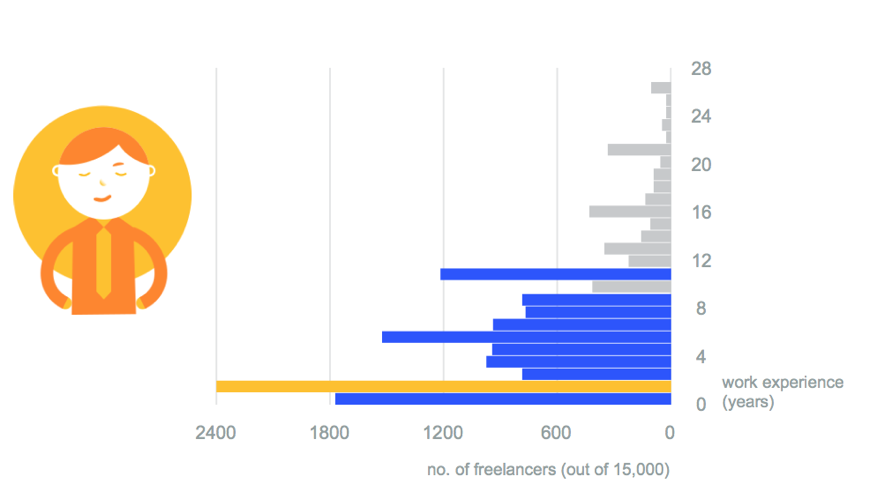
Source: Hubstaff 201 Freelance Trends
Other countervailing data comes from Deloitte’s annual Millennial Survey of 8,000 young professionals globally. It shows inconsistent evidence for the reputation millennials have for job hopping, as fewer are reporting plans to leave their jobs in the near future.
Those responses are mixed with a clear desire for flexible work arrangements. In Deloitte’s analysis, “Millennials appear to want the best of both worlds — freelance flexibility with full-time stability.”
And the WiseBrand survey of freelancers finds that the 35+ age group is less likely to return from freelancing to a job. i.e. They are more committed to freelancing.
Profinder at LinkedIn has published several articles referencing a study there (though I can’t find the study itself), indicating that “the share of full-timers is just about equivalent to the share who are 41 and over: about three out of four.”
That supports a developing thesis of mine that: a.) Freelancing is distributed proportionally across age groups, and b.) People tend to freelance for different reasons at different stages of their careers. For example, it may be that younger professionals are more likely to freelance on the side for extra income while older professionals are more likely to freelance for reasons related to engagement and ownership, and therefore to make a full-time career of it.
However, that thesis will need more data on this subject since the studies haven’t been very consistent with one another.
Ultimately, though, we know that millennials are now the biggest share of the workforce, according to Pew research. More than one-third of workers in the U.S. were between the ages of 18 and 34 in 2015. Which is larger the Gen X workers still in the pipeline, and enough boomers have retired already to decrease their share.
So most of the evidence is pointing to this group making up a bigger share of the gig economy. For example, the Upwork/Freelancer’s Union 2017 survey finds that more millennials freelance (including part-time and side hustling) than the average population: 47 percent millennials versus 36 percent overall in the U.S.
And, according to the Bank of America 2018 Better Money Habits Millennial Report, a quarter of millennials consider themselves part of the gig economy, and a quarter have already experienced a layoff. 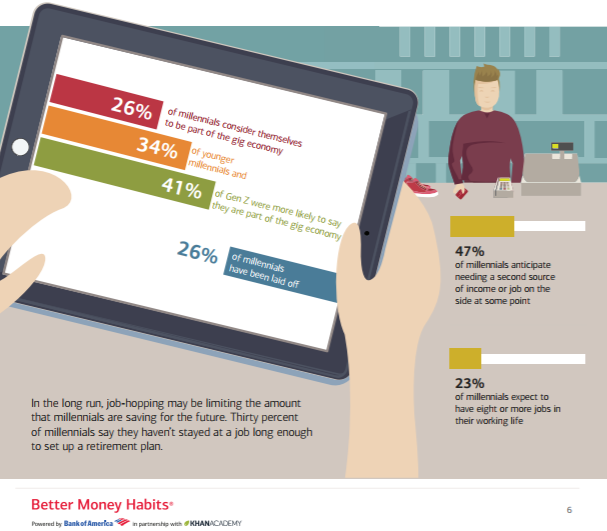 Lastly, a survey of Asian Pacific countries (See PERSOLKELLY discussion below), shows that among current freelancers, millennials are the largest group by far at 20 percent. But Gen Z is much more likely to say they are interested in freelancing.
Interestingly, it’s the oldest and youngest workers — boomers and Gen Z — who say they anticipate benefits to this way of working. They bookend the middle two groups — millennials and Gen X — who are most lukewarm
Other interesting and comprehensive studies of the freelance workforce
The freelance data keeps flowing in as fast as we have a chance to review it. Here are a few of the most comprehensive surveys.
The T. Rowe Price Financial Attitudes and Behaviors Toward the Gig Economy Survey
In February 2018 the financial services firm T. Rowe Price surveyed 800 people to compare how traditional employees and freelancers handle their finances. Along the way, they collected some data that helps with our main question about how many freelancers there are and who they are. 13 percent of their respondents say they work independently in the gig economy.
So that seems to filter out W-2 workers who are supplementing their income and is in line with the 8 to 14 percent figures that other surveys are showing.
They found that freelancing was most common among Gen X. 19 percent of that segment work independently.
They asked several questions about whether freelancing was a choice or a necessity. Even among the small segment who said it was a necessity for them, 67 percent say it had a positive or very positive impact on their finances.
This way of working enjoys a good reputation. Among people familiar with the term “gig economy,” 74 percent said it is having a positive effect on society. All workers associate gig work more strongly with freedom and a better lifestyle and less with financial security and savings.
This confirms what we’re seeing in several other studies — lifestyle and work satisfaction issues are the drivers more than income is. The T. Rowe Price survey shows that freelancers are distributed across income groups in roughly the same proportion as all workers.
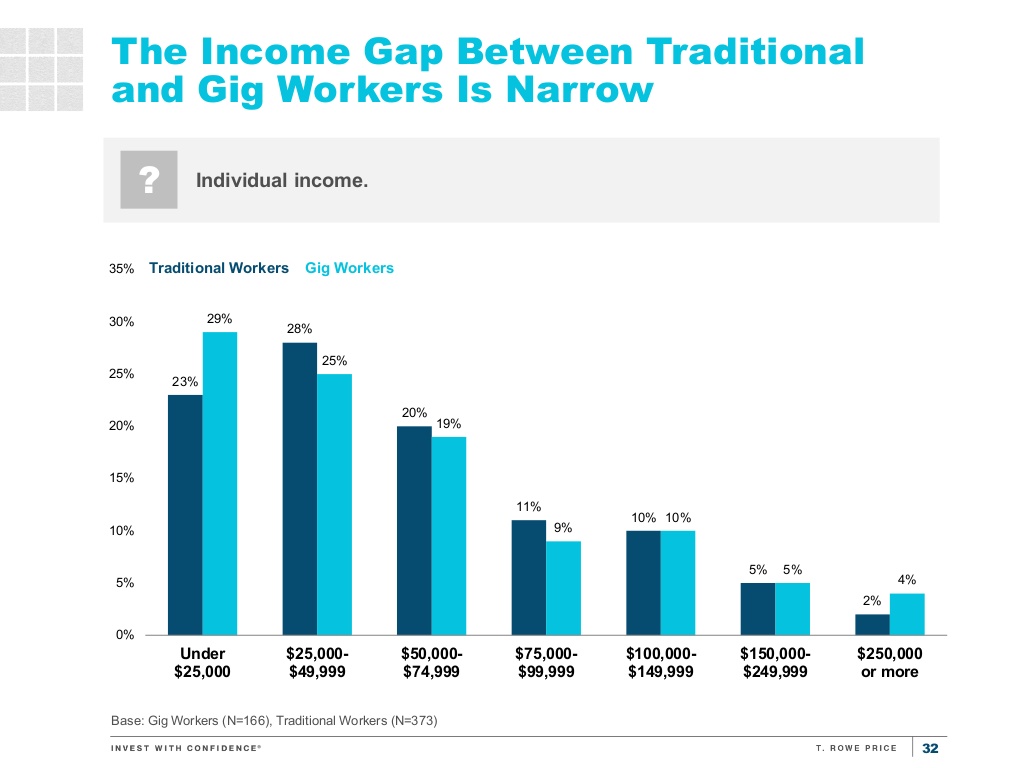
T. Rowe Price study on gig economy workers
This seems to support the MBO data point in their 2017 report that 19.8 percent of full-time freelancers earn $100,000/year or more. T. Rowe Price calculates 17 percent.
Update from MBO’s 2018 report: 20.9 percent of full-time independent workers earn $100,000 or more.
The NPR/Marist “Nature of Work” Poll
January 2018 – This is the first highly authoritative and comprehensive poll on this question since this article was initially written, and it interestingly tallies more freelancers than the original batch we looked at. The NPR/Maris poll of the workforce shows that 20 percent of workers are “contract workers,” which is 13 percent of the workforce if you exclude adults who are retired or otherwise not working.
They define a contract worker as someone who reports as having been hired to work on a specific project for a fixed period of time. Among people with a “main job” — by which they presumably mean w-2 employees — 40 percent also do contract work.
I have to say that when I heard that NPR had a whole week of reporting on The Rise of the Contract Worker pulling from this poll, I was excited to dig in. But the more I look at it, the more annoyed I get.
First of all, very little of this actually has anything to do with the growing freelance workforce. There are more questions about political attitudes of all workers than any questions addressed to status or condition of contract workers in particular.
Second, many of the questions in the survey betray an orientation that presumes W-2 employment. For example, one question asks “if you receive retirement benefits at your job,” and shows that very few contract workers answered yes.
But most contract workers wouldn’t describe themselves as having jobs at all. We have businesses. Does my SEP-IRA count as a retirement benefit for the purposes of this question?
This is an issue I wonder about in many of these surveys. The questions appear to be framed from the perspective that people are W-2 employees, so if you are answering from the perspective of a 1099 worker, the question can be easy to misinterpret or just doesn’t make sense at all. 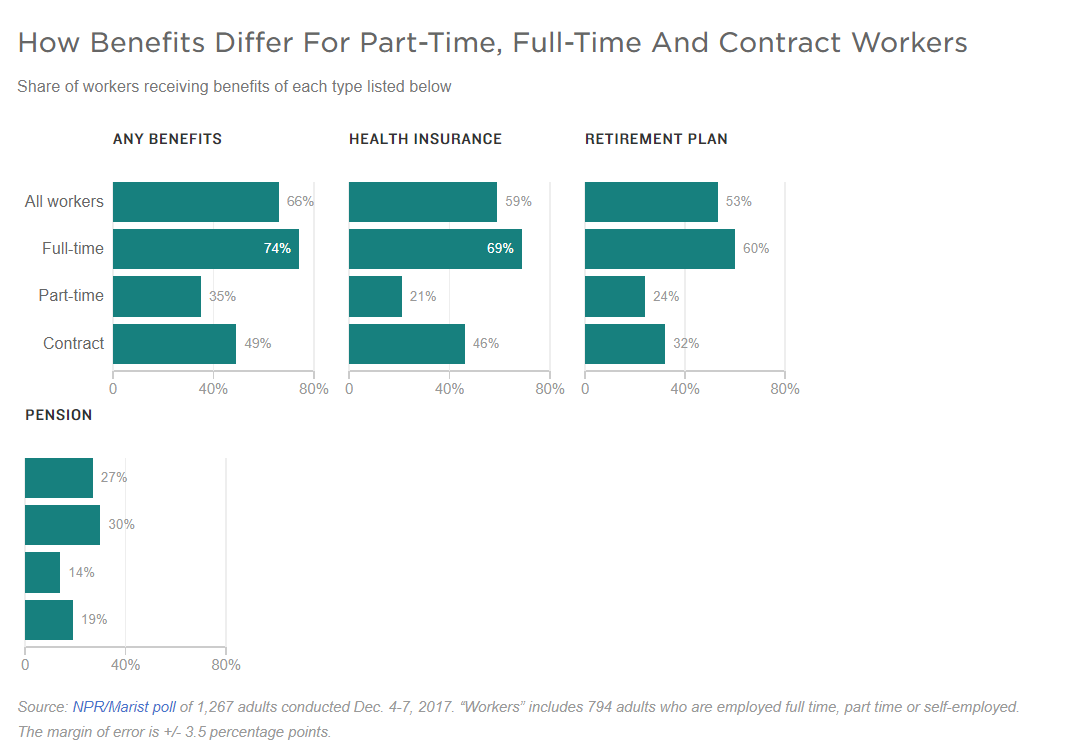 For example, how does a freelancer interpret a question about pay raises at their job? Among the contract workers who see themselves as running a freelance businesses, the issue we’re paying attention to is increased receipts and profits, rather than pay raises. Clients don’t give pay raises. We raise our fees on clients.
Interestingly, contract workers were most likely — sixty percent — to say that their “employers” value the work they do “a great deal.” But that’s still just as confusing a question and answer since contract workers don’t have employers.
And the feature reporting that draws on this data relies on a very fluid definition of contract workers.
One story meant to illustrate how variable gig economy income can be is titled “For One Family, Contract Work Means ‘Feast or Famine’ As Income Varies.” But the people they profiled aren’t contractors at all. They’re W-2 employees at companies that play unpredictable games with shifts and scheduling. As a result of that, one of the couple also finds gig work through a ride sharing app.
The story implies that flex schedule work in a W-2 role is an example of contract work and then damns contract work for making workers vulnerable.
In other words, the problem that NPR is reporting on is how insecure income is for traditional employees, which is one of the main reasons that so many people are choosing freelancing. According to The National Women’s Law Center, 9 out of 10 workers in retail and food service jobs are subject to “variable hours” that comes with the noxious trend of just-in-time scheduling.
I don’t get why NPR choose to characterize that as a problem with contract work. Gig economy work can mean variable income. But so does traditional employment for an increasing share of the workforce. That’s the story that NPR is missing.
The Marketplace-Edison Research Economic Anxiety Index
Added March 2018 – This annual poll from the public radio program Marketplace and Edison Research looks for trend lines on economic anxiety. The February 2018 edition included questions about the gig economy.
They find that 25 percent of the workforce participates in the gig economy and that they are considerably more anxious than the workforce at large.
However, when you dig into the data tables, you see that their tally includes, along with freelance creatives and rideshare drivers, people with any side income. The choices they offer to survey respondents include selling on eBay and Etsy, selling for Avon or Amway or renting out rooms in a personal home.
So that’s a somewhat different bundle of work than other definitions of freelancing above.
Also missing from the examples in their question is any mention of consulting or self-employment, so those workers might not have recognized themselves in the questions.
44 percent of the group of 25 percent say that gig economy earnings are their primary income, which supports our estimate of 11 percent of the economy being full-time freelance.
How many freelancers are there globally?
This is nearly impossible to answer. Most of the surveys cited here are U.S. based. The McKinsey study above is the EU and the U.S. together.
There are more studies about the workforce broadly, without particular attention to the gig economy, that look globally or at different regions. The EY study noted a few times throughout this article is one example.
But let’s start gathering freelance statistics from outside the U.S. when they do emerge and see what we can learn. I suspect these will typically turn out to be about individual countries or regions rather than global.
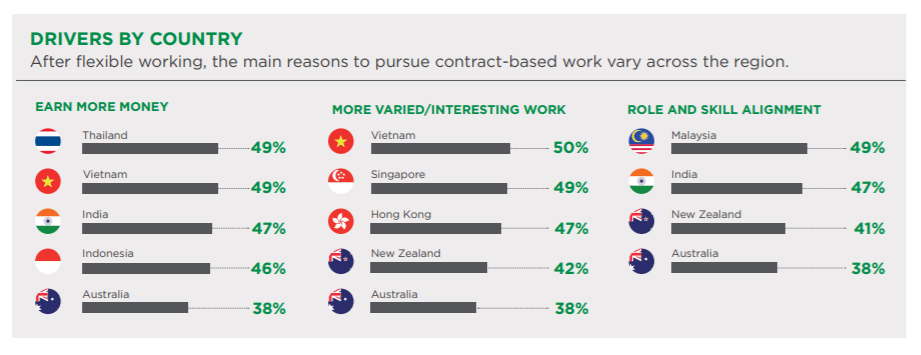
One really impressive study is from PERSOLKELLY, a workforce solutions company that works in the APAC (Asia Pacific) region. In 2017, they conducted an online survey with both hiring managers and “candidates” between 20 and 70 years old, across the following countries: Australia, Hong Kong, India, Indonesia, Malaysia, New Zealand, Singapore, Thailand and Vietnam.
The report, APAC Workforce Insights – Gig Economy: How Free Agents Are Redefining Work, is interesting in that it gets the point of view of both the hiring and the worker side. But it’s not clear who the “candidates” are and therefore I wonder if it under counts full-time freelancers who aren’t looking for work.
They are also working with a different vocabulary. The survey says that 3 percent of the respondents are currently freelance but that another 16 percent are in fixed term/contract roles that are non-permanent.
In either case, Hong Kong is where the trend is strongest among these countries.
The APAC survey is more about attitudes about freelancing, though. The headline is that 43 percent of all respondents agree that people looking for work today are more likely to be seeing flexible contract-based roles vs. permanent roles.
Interestingly, hiring managers are more likely to say this (47 percent) than candidates themselves (41 percent).
The biggest drivers are just like in any every other survey of freelancers we’ve looked at, though in a different priority order: flexibility, interesting work (another way of saying mission and engagement) and taking control of one’s own career.
2018 APAC Workforce Insights – Gig Economy: How Free Agents Are Redefining Work
What it’s like being a freelancer
Updated 8/15/18: Studies are beginning to emerge that tell us more about the working life and other lifestyle characteristics of freelancers, and I’ll track those here.
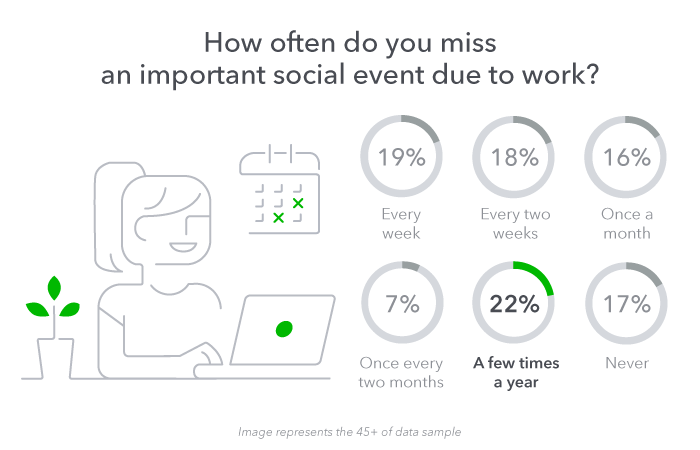
Quickbooks Self-Employed, the self-employment tax software, conducted a survey on the realities of self employment and identified several “unpleasant realities” including long hours and financial stress.
For example, 53 percent of this group miss important social events at least once a month or more due to work. These include family birthdays, weddings, reunions and vacations.
They also show that the majority of this freelancers work on vacation and work when they are sick. It’s hard to know how much that is a function of being freelance without data on how many role-based employers are working on their vacation days and not using sick days when they should.
(By the way, our freelance rates calculator quantify how freelancers could take paid vacation and paid sick days if they built that into their client fees.)
Likewise, the survey respondents work a lot of weekends.
However, the total hours that respondents in this survey put in isn’t off the charts. The plurality — 39 percent — work less than full-time. One third work 40 hours/week. And the remainder were spread between 50 and 80 hours/week. My interpretation is that many freelancers have less of a workload problem than a problem managing their schedules and client expectations.
The Quickbooks study also shows that over half of self-employed workers who are 45 or older say cash flow worries keep them up at night. This echoes other studies we’ve seen that, while freelancer treasure their independence and flexibility, worries about the variable income are the biggest downside.
AND CO by Fiverr, also a financial management software for freelancers, has an in-depth report on the lifestyle of “remote workers.” That’s a broader category, but 64 percent of respondents to the Anywhere Workers survey idenfitied as either freelance or self-employed. The rest presumably are “traditional” employees at companies with remote work options.
That supports another trend that I’ve written about elsewhere — that the freelance lifestyle is rubbing off on traditional employees who are adopting the same ways of working, whether it is project-based work, a preference for cowork style environments, more job hopping or, in this case, working remotely.
The study confirms some of what you would expect. Freedom and flexibility is the big attraction for 62 percent of respondents.
Perhaps surprising to some, combining work with travel — digital nomadism — is attractive in theory, but only 24 percent of remote workers are actually doing that, and not all of them do so regularly. Only 17 percent said they are based abroad or evenly split time between home and abroad. The rest generally work in their home country. (e.g. see our article: A Digital Nomadism Reality Check.) Nine percent said that combining work with travel was the reason they went remote.
Thirty percent say the biggest downside is the loneliness. But 80 percent say they want to continue this way of working indefinitely. It’s still a relatively new way of working (or has a lot of churn), with 73 percent saying they’ve been remote workers for four years or less.
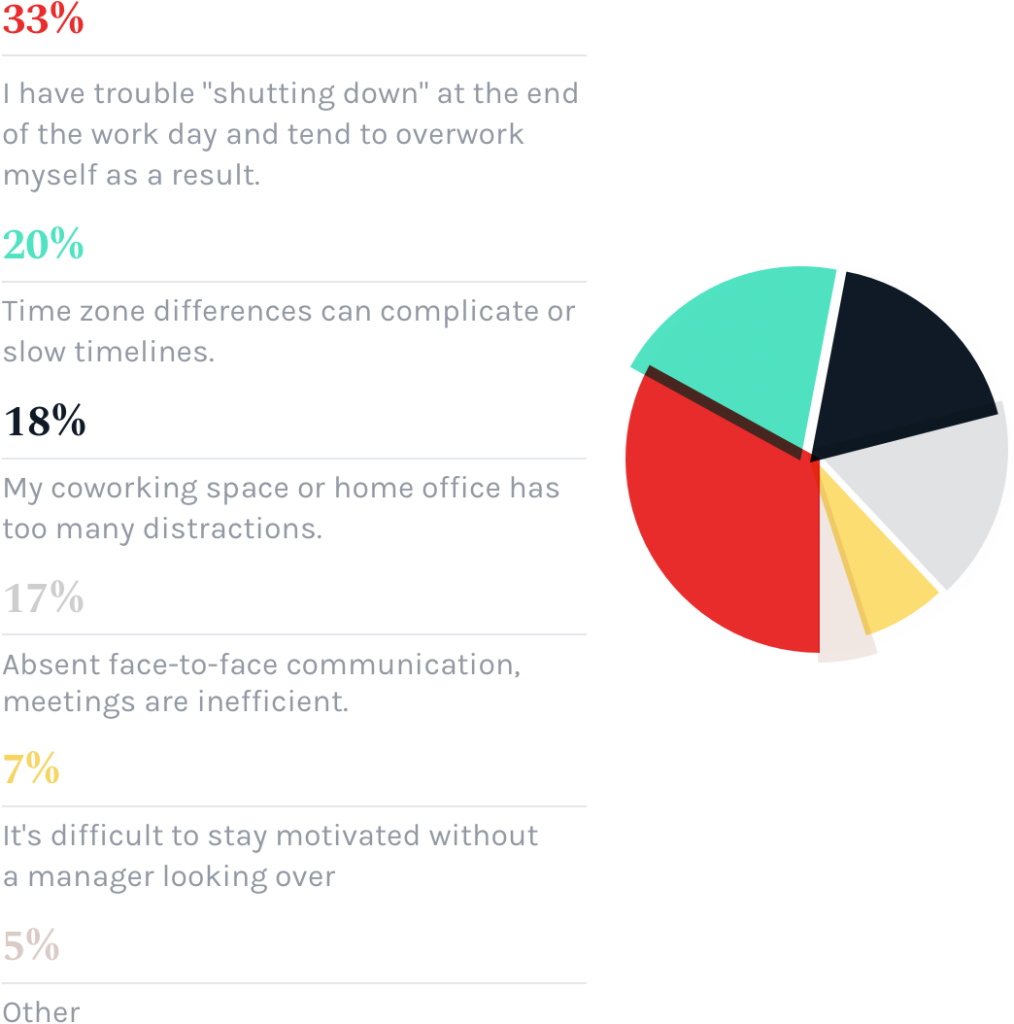
When asked for their top productivity challenge, respondents in the AND CO survey see themselves as much more likely to overwork themselves than to feel undirected.
Three trends that show how the freelance workforce is changing
I want to point out three trends in the data that help explain who is in the gig economy.
Trend 1: Freelancing no longer means “between jobs.”
We noted that some freelancers are reluctant to be in the gig economy, but a growing share of them are “freelance by choice” — 70 percent according to the McKinsey Global Institute study quoted above.
Similarly, 81 percent of the freelancers and other gig workers surveyed by the ManpowerGroup said that their non-traditional careers were a choice rather than a necessity.
The Upwork/Freeelancer’s Union 2017 survey finds a lower number but a similar trend in that direction. 63 percent say that they freelance by choice, which is up from 53 percent in the 2014 survey.
According to the ReportLinker survey cited above, freelancers have a much more optimistic view than their salaried peers, and 32 percent are “strongly convinced they’re happier than their counterparts.” 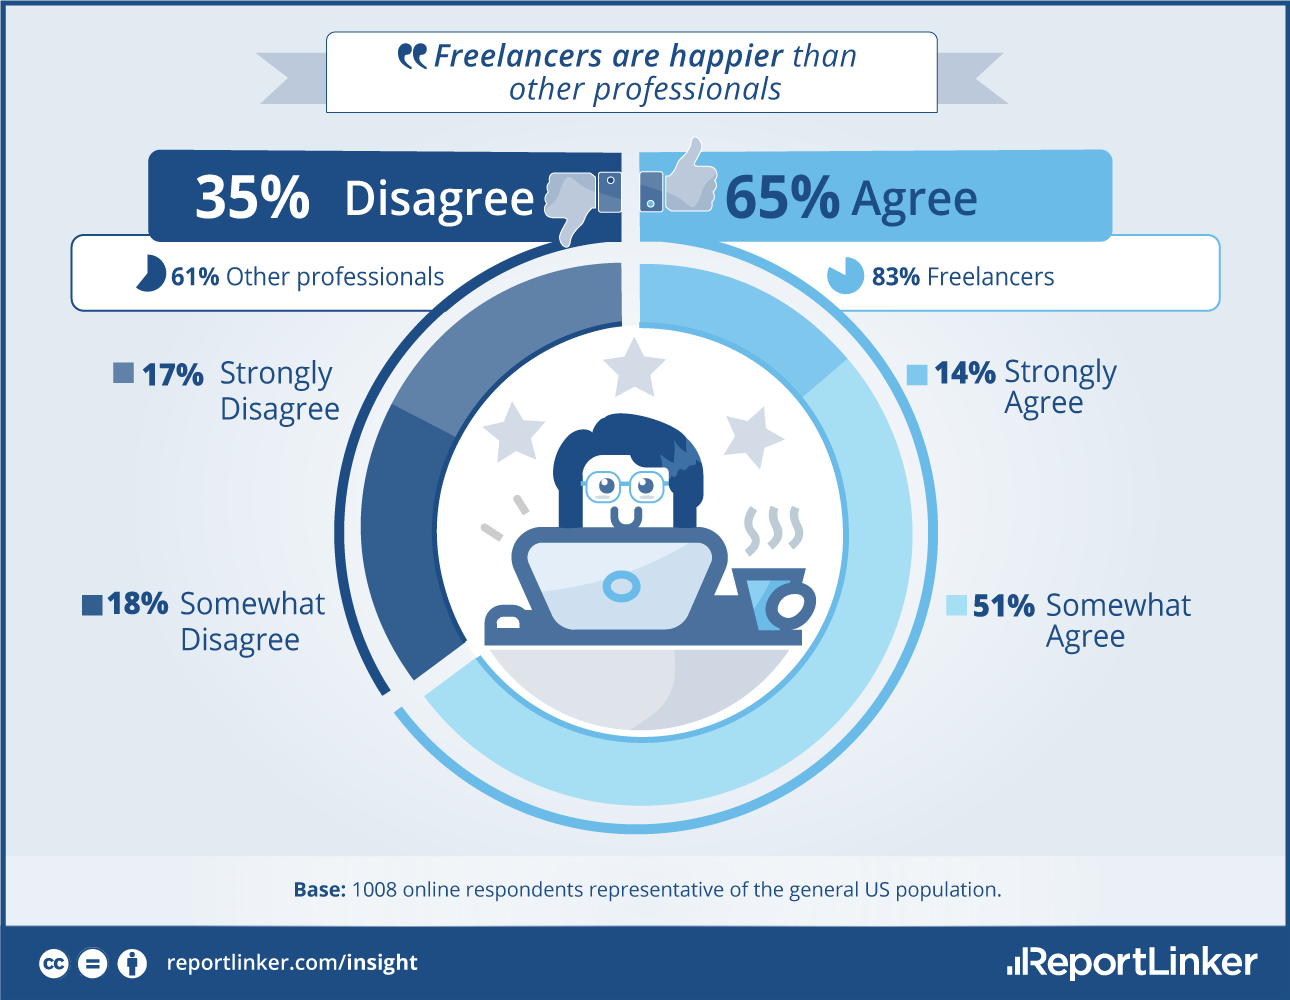 And according to the 2016 Field Nation Freelancer Study: The Changing Face of the New Blended Workforce:
- 74 percent of professional freelancers say it is their ideal employment situation.
- 95 percent say they love, like or are satisfied with what they do on a daily basis.
- 86 percent said they opted into freelancing.
- 72 percent say they make the same amount or more money than they did before.
- 45 percent of freelancers characterize themselves as small business owners and entrepreneurs.
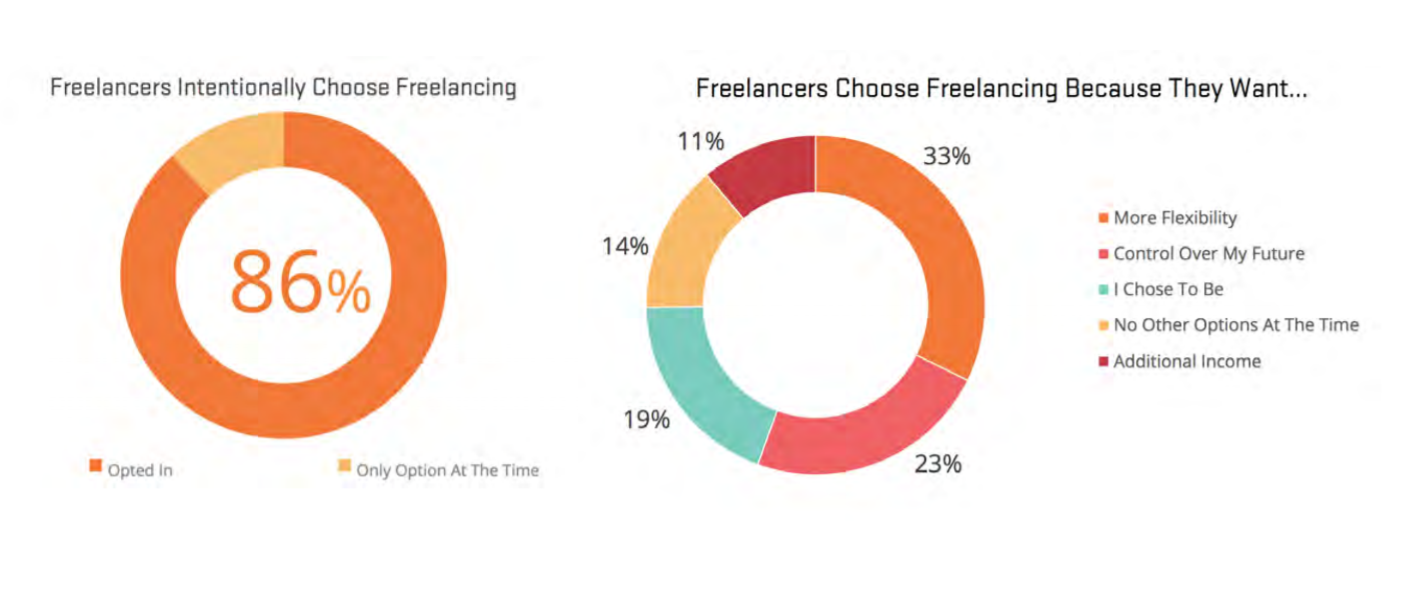
Source: Field Nation Freelancer Study: The Changing Face of the New Blended Workforce
The WiseBrand survey finds that 54 percent of freelancers have no interest in returning to full-time employment.
In the 2018 MBO survey, 72 percent of “full-time independents said they are very satisfied (between 8-10 on a scale of 1-10) work as an independent.”
Trend 2: Freelance doesn’t necessarily mean outsider
The Field Nation study notes that one of the factors driving the growth of the gig economy is “evolving team structures that reinforce collaboration and support freelance workers across every stage of engagement.”
The growth of the gig economy is part of a larger change in the nature of work that might be better described as the “blended workforce” model. The blend is unique to every project, and that means in practice that a gig economy worker may be more “internal” than some employees. Employees can be remote, and consultants can be brought in to work on site for extended contracts.
At Nation1099, we strongly believe that companies that don’t manage freelancers as if they are outsiders, disposable or “unemployed” are developing a talent management strategy based on the future of work.
Trend 3: Freelancers earn more than you might think
On this point too, there is an inconsistent story across all the studies.
The MBO 2017 survey, which looks only at professionals who work in the gig economy, finds that nearly one in five of full-time independents in the U.S. earn more than $100,000/year. They also note that the average income for full-time freelancers was $65,300, while the median household income in the U.S. was $56,516 in 2015.
Update from 2018 report: It’s over 20 percent now — 20.9 percent early $100,000/year or more. That’s 3.3 million people. The average annual income for this group is now $69,100 versus a U.S. median household income of $59,039.
MBO found in 2018 that only 46 percent of independent workers earn more than as employees. And there was interesting difference between men and women. 56 percent of men earn more money independently, and 44 percent of women do. In other words, slightly more than half of men get a pay raise when they go solo, and slightly more than half women get a pay cut. But women are far more likely to prioritize flexibility and control over their own schedule.
The WiseBrand survey of freelancers finds that the average freelancer meets their financial goal within two years and that 42 percent reach it within one year. Of those who say they reached their financial goal, half say they are earning $75,000 per year, and more than half say they are saving. Sixty percent say they have life insurance.
The Hubstaff survey looks at a broader range of the gig economy and finds that the average freelance rates are $37.87 in the U.S., $40,17 in Canada and $46.54 in Great Britain. $37/hour booked full-time for a year (which is unlikely of course), would be about $74,000 in gross receipts.
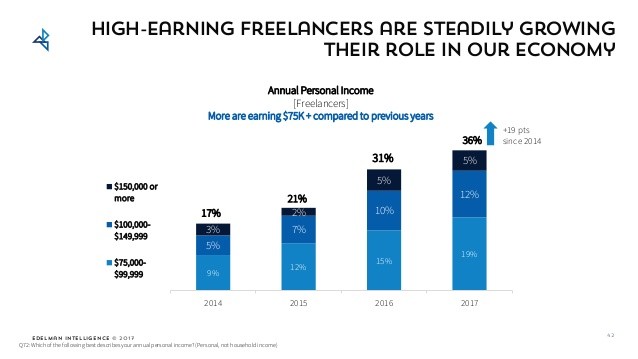
The 2017 version of the Freelancers Union/Upwork survey looks at an even broader swath of people and counts “high-earning freelancers.” They find that 36 percent of freelancers earn more than $75,000/year. Twelve percent earn more than $100,000/year. I suspect that the difference between Freelancers Union/Upwork and MBO on that point can be chalked up to their membership groups.
MBO serves more consultants providing strategy, planning and management skills. Upwork’s membership knowledge workers providing direct creative services that are compensated at a lower rate.
The Freelancers Union/Upwork survey also shows that 2 out of 3 freelancers make more money than they did in their old job.
The future of the gig economy
The best way to predict the growth of the gig economy may be to look at all those side hustlers who I’ve tried to sift out of the survey results. The most likely person to become a full-time freelancer is part-time freelancer.
As the Upwork/Freelancers Union 2017 shows, there are 13 million moonlighters, and more than a third of them are dreaming of a jailbreak from regular employment, though according to historical trends, only a fraction of them actual do.
Similarly, the 2018 MBO survey found that 15 percent percent of traditional workers (31 million people) said they “definitely will or probably will” go solo in the next two or three years. That’s an increase from 13 percent in 2017. However, historically only about 10-15 percent of that group — 3-4 million people — follow through.
Which is presumably how MBO gets to an annual growth projection of 2.6 percent in the freelance workforce, more than three times the growth of the overall workforce.
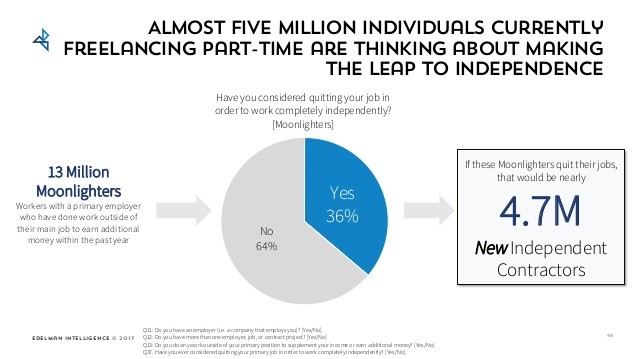
Source: Upwork/Freelancers Union Freelancing In America 2017
As I noted earlier, the consulting firm Accenture is publishing a lot of interesting material that looks at the future of work and what it means for employers.
Another of their reports, Workforce Marketplace: Invent Your Own Future, argues that in the next five years everything we assume about “full time employment and freelancers will flip completely.” On-demand talent platforms will serve as the primary driver of economic growth around the world and they will eventually replace conventional management models.
As I’ve written elsewhere, this means employers will have to think very differently about how they cultivate and engage with freelance talent. The employers who see gig economy workers as partners will be setting themselves to succeed in this new labor environment.
For example, the McKinsey Global Institute’s study highlighted many real economic benefits of the gig economy that will accrue to employers including increased engagement and improved productivity.
Finally, let me leave you with the conclusions of The World Economic Forum’s The Future of Jobs report, which looks at various socio-economic and technology trends and predicts a “perfect storm” of business change:
“Telecommuting, coworking spaces, virtual teams, freelancing and online talent platforms are all on the rise, transcending the physical boundaries of the office or factory floor and redefining the boundary between one’s job and private life in the process. Modern forms of workers’ organization, such as digital freelancers’ unions and updated labor market regulations are beginning to emerge to complement these new organizational models. The challenge for employers, individuals and governments alike is going to be to work out ways and means to ensure that the changing nature of work benefits everyone.”
The gig economy is here, largely as a result of technology changes we’re all familiar with. What comes next is when it gets big enough to be its own force, fundamentally changing work and workplaces in turn.
Research and writing assistance contributed by Joseph Mapue

Robert McGuire
Publisher of Nation1099
Robert McGuire is the owner of McGuire Editorial, a content marketing services firm specializing in B2B and tech startups.


